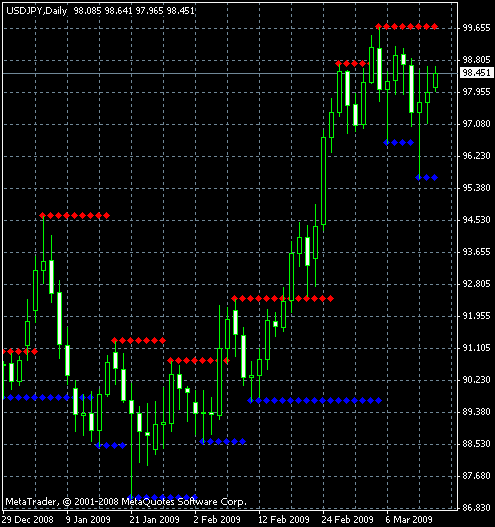
Support and Resistance MetaTrader indicator — as the name of
this indicator suggests, it displays
the support and resistance levels. It shows them directly on the chart,
providing an easy help when you want
to set stop-loss or take-profit level, or when you want to see the next market
target. This indicator uses
the standard MetaTrader Fractals indicator (by Bill Williams' method) and
has no changeable input parameters.

The picture says it all. Use the levels marked by the blue dots for support
and the levels
marked by the red dots for resistance. And don't forget that support may
become next resistance if breached and vice versa.